
Smarter Balanced Assessment Consortium (SBAC)
Prologue
The Smarter Balanced Assessment Consortium (SBAC) is a standardized test consortium. It creates Common Core State Standards-aligned tests (computer adaptive online exams) to be used in several states. This assessment has been designed for all students in that it is customized to students’ learning levels and is also a predictor for college and career readiness. The SBAC Mathematics assessment measures student skill sets in concepts and procedures, problem solving, communicating reasoning, measurement and data, operations and algebraic reasoning, and geometry. The SBAC is currently administered in grades 3-8. The data depicted here represents Stevensville School District student proficiency compared to state proficiency.
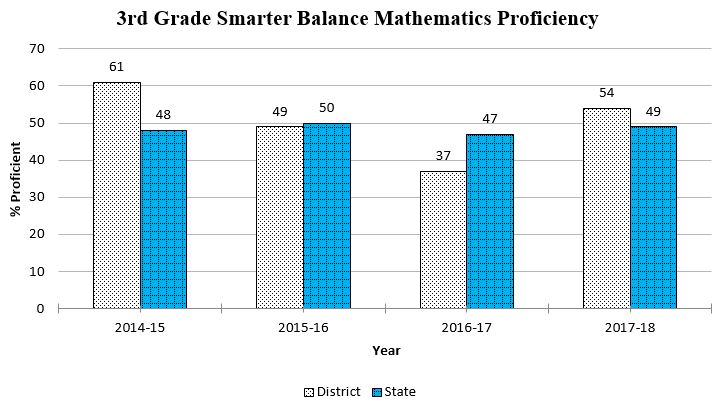
Third Grade Narrative
In spring 2014-2015, the state math score for proficiency and above was 48% of the students assessed. The Stevensville District 3rd grade was 13% above at 61% proficient for a total of 74% meeting or exceeding proficiency. In spring 2015-2016, the state score for proficiency and above was 50% of the students assessed. The Stevensville 3rd grade was 1% below at 49% of the students assessed. In spring 2016-2017, the state score for proficiency and above was 47% of the students assessed. The Stevensville 3rd grade was 10% below at 37% of the students assessed. In spring 2017-2018, the state score for proficiency and above was 49% of the students assessed. The Stevensville 3rd grade was 5% above at 54% of the students assessed.
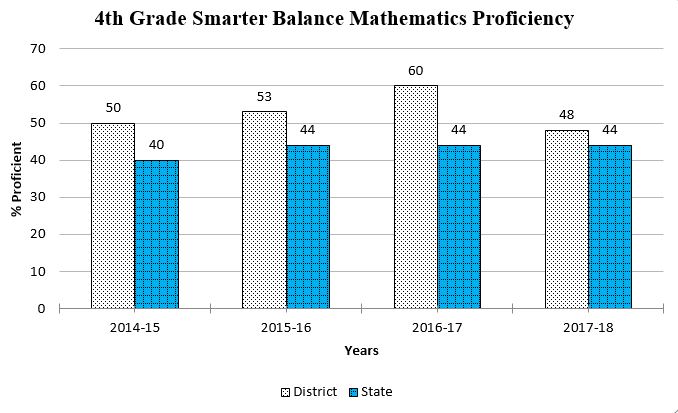
Fourth Grade Narrative
In spring 2014-2015, the state math score for proficiency and above was 40% of the students assessed. The Stevensville District 4th grade was 10% above at 50% proficient. In spring 2015-2016, the state score for proficiency and above was 44% of the students assessed. The Stevensville 4th grade was 9% above at 53% of the students assessed. In spring 2016-2017, the state score for proficiency and above was 44% of the students assessed. The Stevensville 4th grade was 16% above at 60% of the students assessed. In spring 2017-2018, the state score for proficiency and above was 44% of the students assessed. The Stevensville 4th grade was 4% above at 48% of the students assessed.
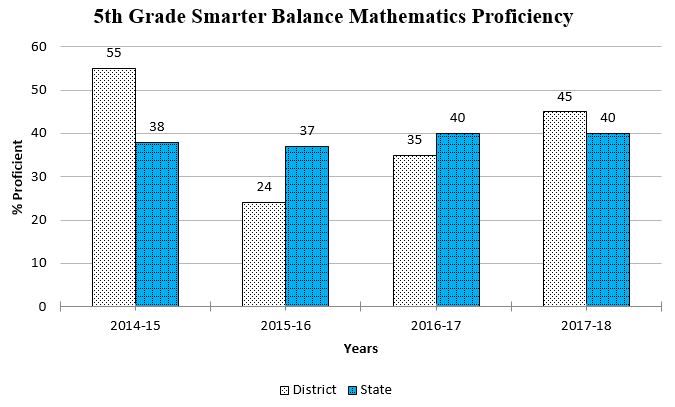
Fifth Grade Narrative
In spring 2014-2015, the state math score for proficiency and above was 38% of the students assessed. The Stevensville District 5th grade was 17% above at 55% proficient. In spring 2015-2016, the state score for proficiency and above was 37% of the students assessed. The Stevensville 5th grade was 13% below at 24% of the students assessed. In spring 2016-2017, the state score for proficiency and above was 40% of the students assessed. The Stevensville 5th grade was 5% below at 35% of the students assessed. In spring 2017-2018, the state score for proficiency and above was 40% of the students assessed. The Stevensville 5th grade was 5% above at 45% of the students assessed.
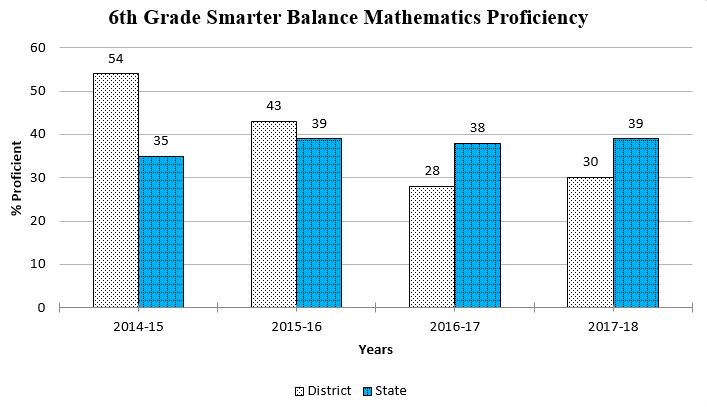
Sixth Grade Narrative
In spring 2014-2015, the state math score for proficiency and above was 35% of the students assessed. The Stevensville District 6th grade was 19% above at 54% proficient. In spring 2015-2016, the state score for proficiency and above was 39% of the students assessed. The Stevensville 6th grade was 4% above at 43% of the students assessed. In spring 2016-2017, the state score for proficiency and above was 38% of the students assessed. The Stevensville 6th grade was 10% below at 28% of the students assessed. In spring 2017-2018, the state score for proficiency and above was 39% of the students assessed. The Stevensville 6th grade was 9% below at 30% of the students assessed.
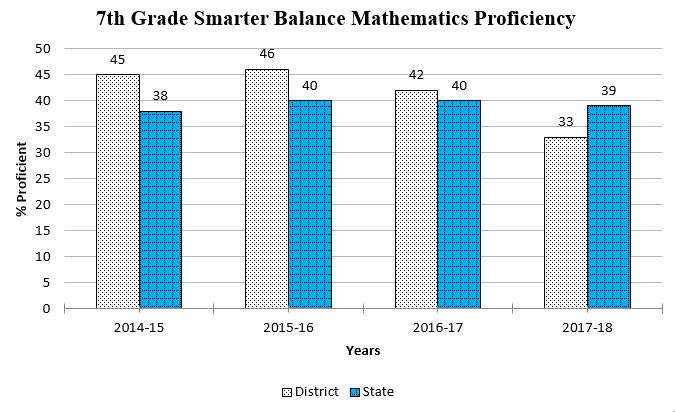
Seventh Grade Narrative
In spring 2014-2015, the state math score for proficiency and above was 38% of the students assessed. The Stevensville District 7th grade was 7% above at 45% proficient. In spring 2015-2016, the state score for proficiency and above was 40% of the students assessed. The Stevensville 7th grade was 6% above at 46% of the students assessed. In spring 2016-2017, the state score for proficiency and above was 40% of the students assessed. The Stevensville 7th grade was 2% above at 42% of the students assessed. In spring 2017-2018, the state score for proficiency and above was 39% of the students assessed. The Stevensville 7th grade was 6% below at 33% of the students assessed.
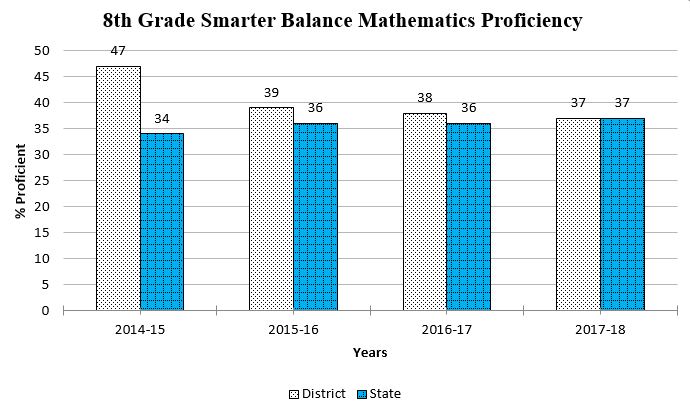
Eighth Grade Narrative
In spring 2014-2015, the state math score for proficiency and above was 34% of the students assessed. The Stevensville District 8th grade was 13% above at 47% proficient. In spring 2015-2016, the state score for proficiency and above was 36% of the students assessed. The Stevensville 8th grade was 3% above at 39% of the students assessed. In spring 2016-2017, the state score for proficiency and above was 36% of the students assessed. The Stevensville 8th grade was 2% above at 38% of the students assessed. In spring 2017-2018, the state score for proficiency and above was 37% of the students assessed. The Stevensville 8th grade was also at 37% of the students assessed.