
Measures of Academic Progress (MAP)
Prologue
The following pages contain Measures of Academic Progress assessment (MAP) data listed by content areas of math, reading, and language. The MAP National Norms changed starting fall, 2015 as the District started using the web-based assessment instead of the local server-based assessment.
District RIT Mean Compared to the National Norms for Reading
Prologue
The MAP (Measures of Academic Progress) assessment is given twice per year consistently in grades 3-8. This is a computer adaptive assessment that gives educators a norm referenced RIT score for each child. MAP is a district-chosen assessment, which fulfills the state’s mandate to use another form of assessment besides the Smarter Balanced (SBAC). Data comparisons are between the District RIT (Rausch Unit) Mean and the National Norms. Student testing is scored on a scale continuum that spans grades third through eighth and ranges from 160-230. The testing data is used by instructional staff to place students into instructional groups, provide insight into student performance by goal performance area, and help guide effective instruction. The following graphs compare data fall to spring in grades third through eighth.
*Note: The MAP National Norms changed starting fall, 2015 as the District started using the web-based assessment instead of the local server-based assessment.
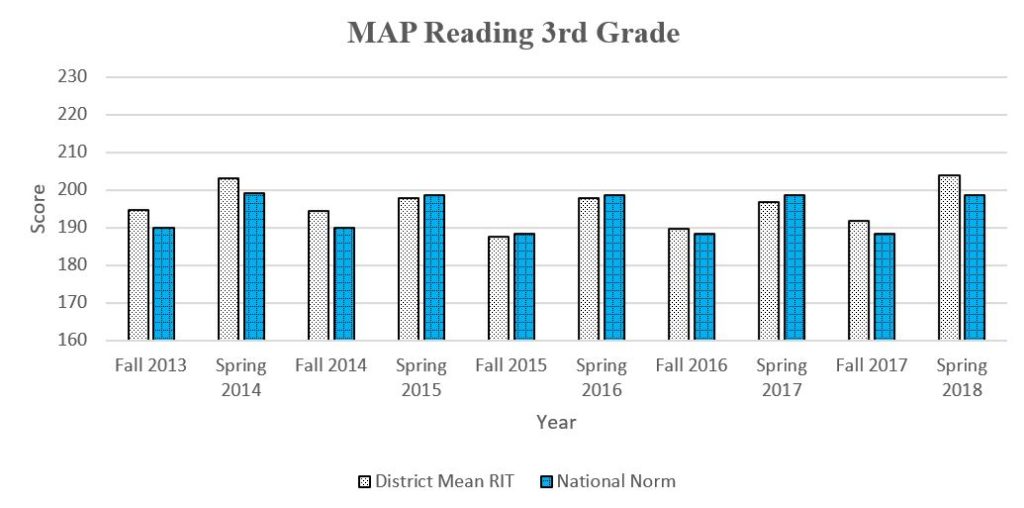
Narrative of the District RIT Mean and National Norms for Third Grade
The graph below indicates that third grade students achieved near or above the national norm for the past five years. District mean scores have generally matched national mean scores, excluding the cohort 2015-16 and 2016-17 did not exceed national norms. District and National mean scores have shown approximately 10 point growth fall to spring.
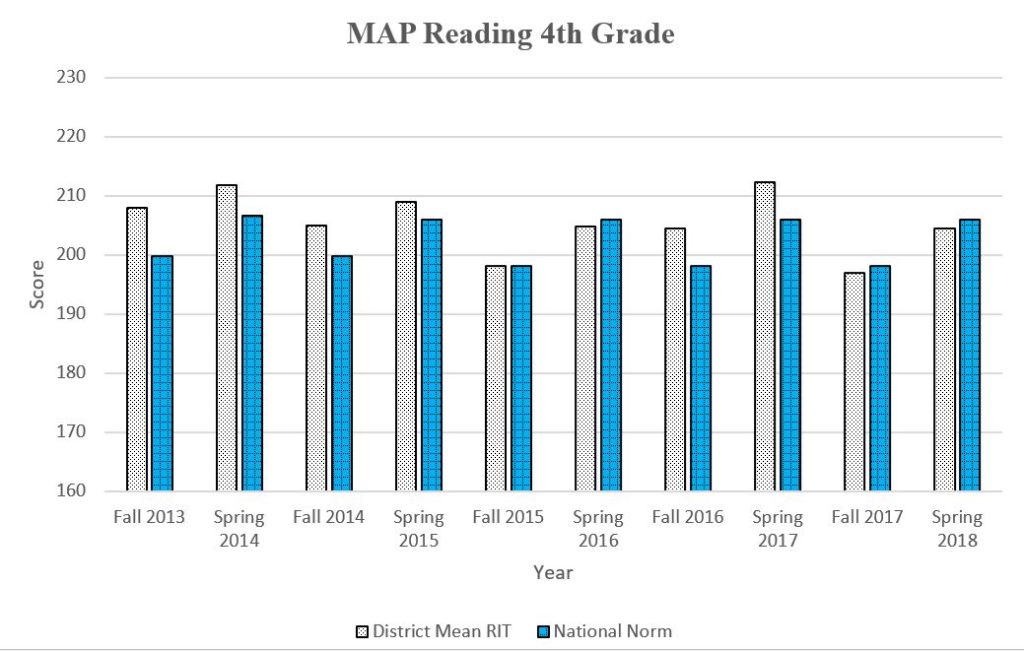
Narrative of the District RIT Mean and National Norms for Fourth Grade
The graph below indicates that fourth grade students achieved at or above the national norms for the past five years, excluding 2015-16. The 2015-16 and 2017-18 cohorts started below national norms, showed typical growth. These groups finished below national norms. All other cohorts exceeded national norms.
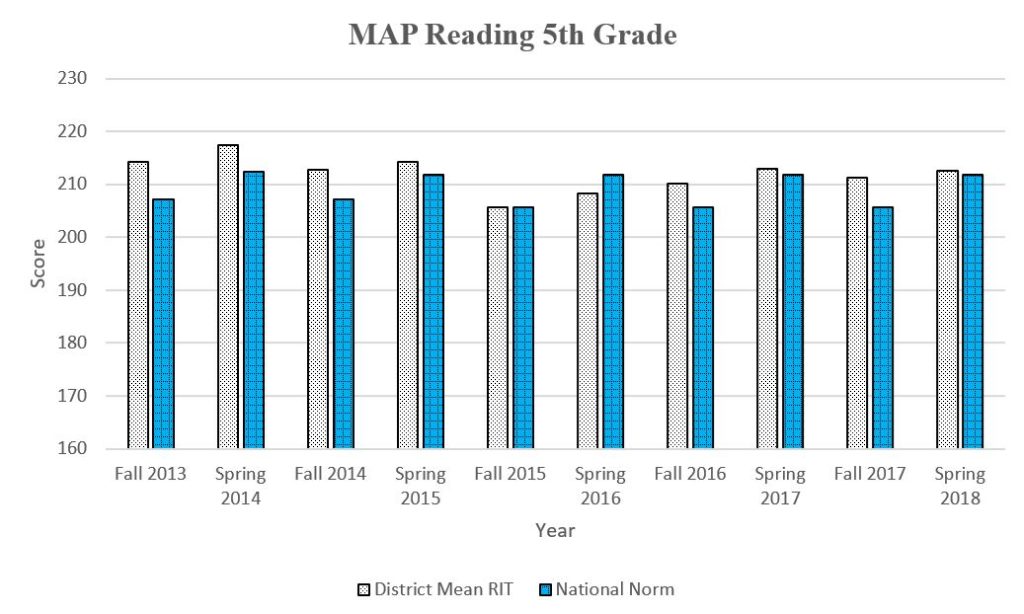
Narrative of the District RIT Mean and National Norms for Fifth Grade
The graph below indicates that fifth grade students achieved at or above the national norms for the past five years, excluding 2015-16.
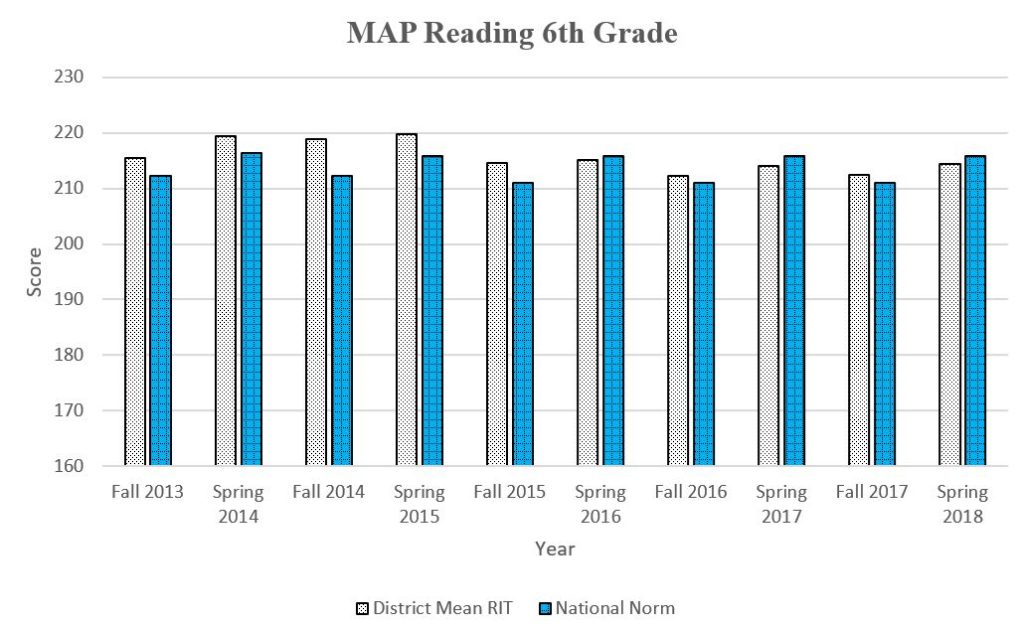
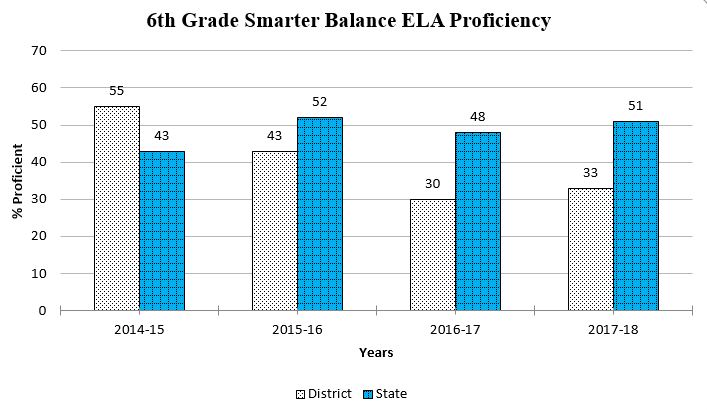
Narrative of the District RIT Mean and National Norms for Sixth Grade
The graph below indicates that sixth grade students achieved at or below expected growth for the past three years as indicated by the spring of 2017 and 2018 scores.
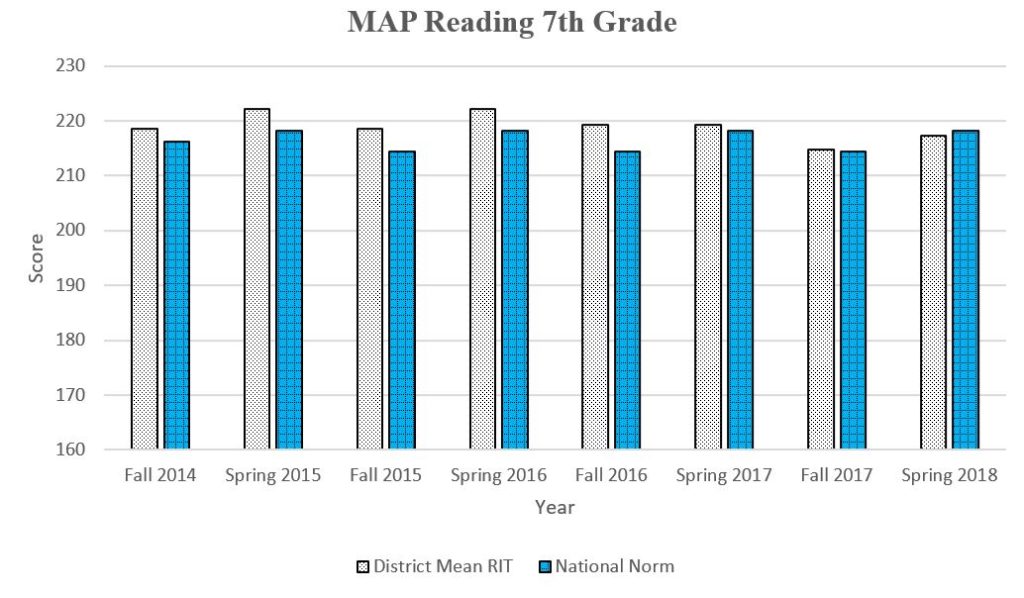
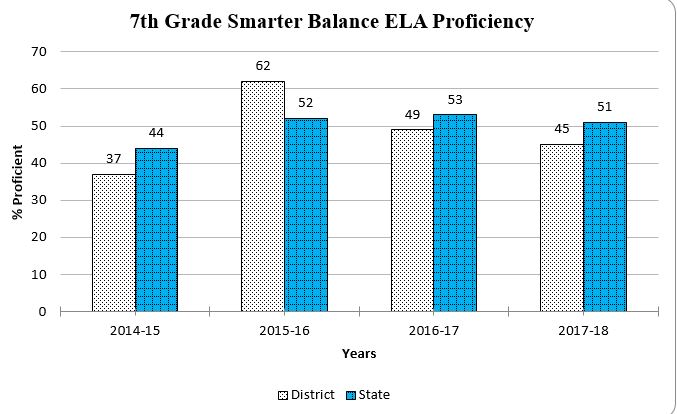
Narrative of the District RIT Mean and National Norms for Seventh Grade
The graph below indicates that seventh grade students achieved at or above the national norms for all years except the 2017-18 school year.
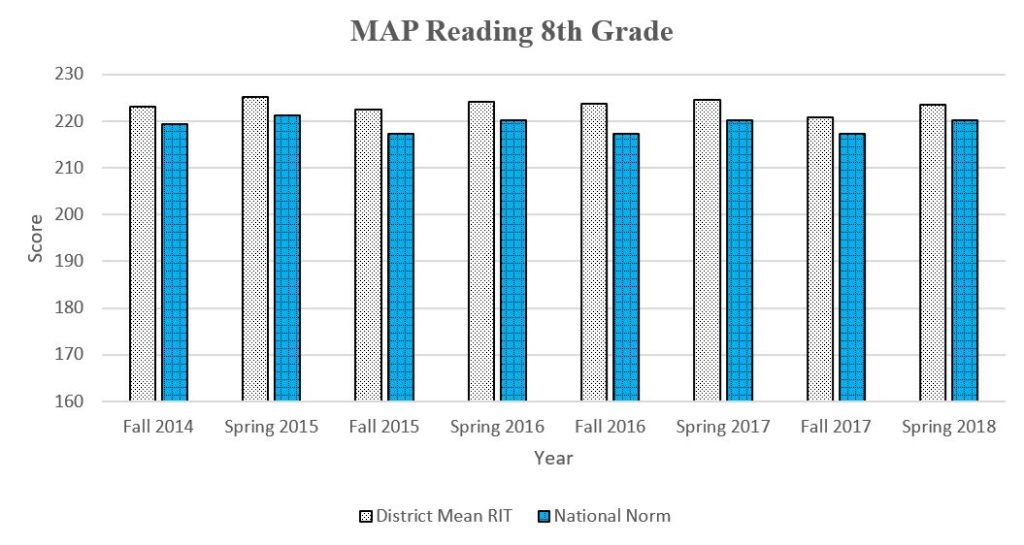
Narrative of the District RIT Mean and National Norms for Eighth Grade
The graph below indicates that eighth grade students achieved at or above the national norms for the past four years.
District RIT Mean Compared to the National Norms for Math
Prologue
The MAP (Measures of Academic Progress) assessment is given twice per year consistently in grades 3-8. This is a computer adaptive assessment that gives educators a norm referenced RIT (Rausch Unit) score for each student. MAP is a district-chosen assessment, which fulfills the state’s mandate to use another form of assessment besides the Smarter Balanced (SBAC). Data comparisons are between the Stevensville School District RIT Mean and the National Norms. We have compared data from each grade level’s fall scores from 2013-2018 in grades 3-8. Student testing is scored on a scale continuum that spans grades third through eighth and ranges from 160-240. The testing data is used by instructional staff to place students into instructional groups, provide insight into student performance by goal performance area, and help guide effective instruction.
*Note: The MAP National Norms changed starting fall, 2015 as the District started using the web-based assessment instead of the local server-based assessment.
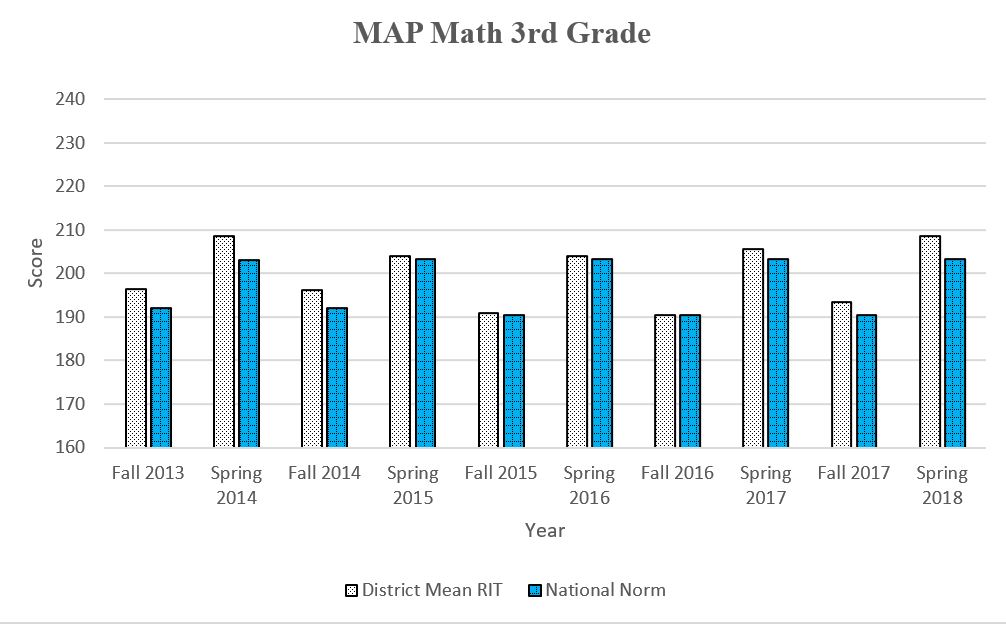
Narrative of the District RIT Mean and National Norms for Third Grade
The graph below indicates that third grade students achieved at or above the national norms. There was a significant drop from 2014 and 2015. The third grade average RIT score remained the same from fall 2015 to fall 2016.
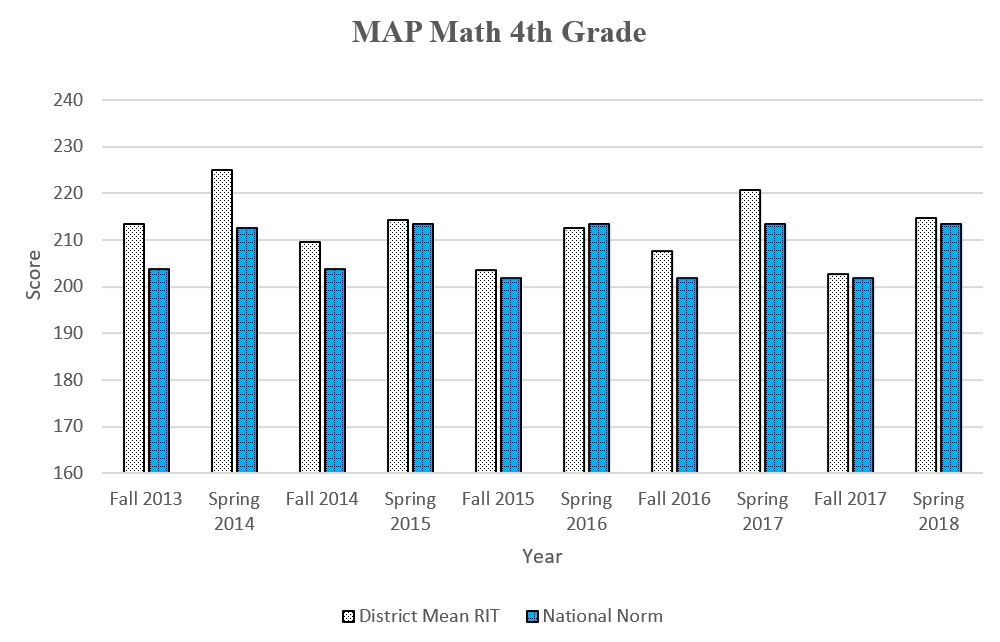
Narrative of the District RIT Mean and National Norms for Fourth Grade
The graph below indicates that fourth grade students achieved at or above the national norms. There was a significant drop from 2014 to 2015 when the test was re-normed nationally. The fourth grade average RIT dropped from fall 2013 to fall 2015. The fourth grade average scores showed expected growth in all years when compared to national norms.
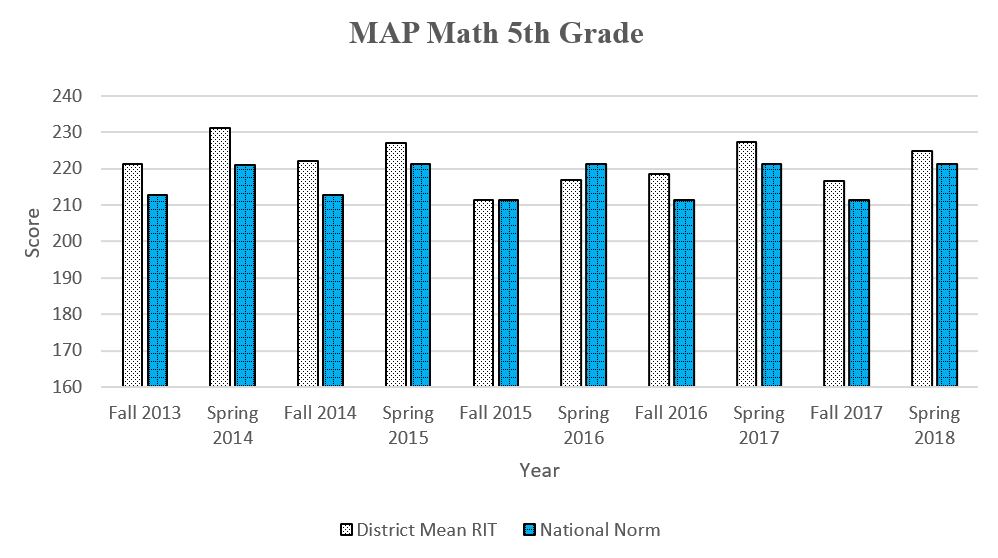
Narrative of the District RIT Mean and National Norms for Fifth Grade
The graph below indicates that fifth grade students achieved at or above the national norm, excluding 2015-16 which was the year the test was re-normed. All other years show expected growth when compared to national norms.
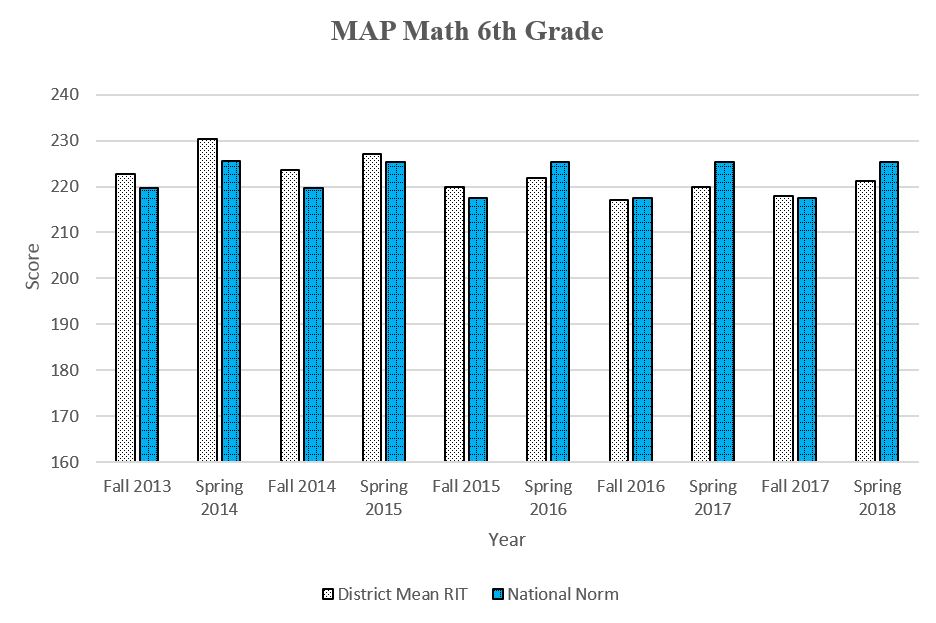
Narrative of the District RIT Mean and National Norms for Sixth Grade
The graph below indicates that sixth grade students achieved at or above the national norms, excluding 2016-17 and 2017-2018. Growth is not at national norm levels for the years 2015-2018.
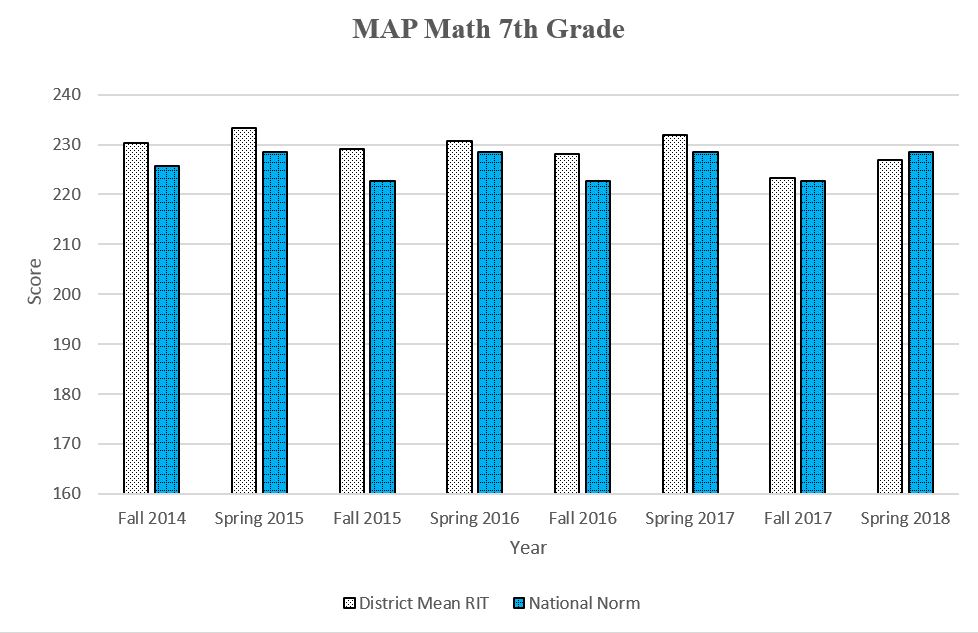
Narrative of the District RIT Mean and National Norms for Seventh Grade
The graph below indicates that seventh grade students achieved at or above the national norm for the past three years. In 2017-18 students scored at or just below the national norm.
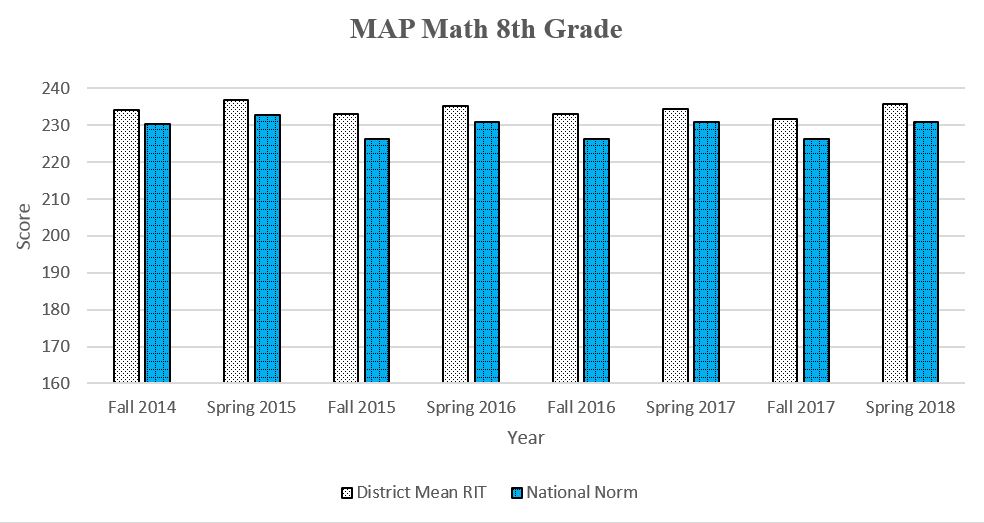
Narrative of the District RIT Mean and National Norms for Eighth Grade
The graph below indicates that eighth grade students achieved at or above the national norm.
District RIT Mean Compared to the National Norms for Language Usage
Prologue
The Measures of Academic Progress (MAP) assessment is given twice per year consistently in grades 3-8. This is a computer adaptive assessment that gives educators a norm referenced Rausch Unit (RIT) score for each child. MAP is a district-chosen assessment, which fulfills the state’s mandate to use another form of assessment besides the Smarter Balanced (SBAC). Data comparisons are between the District RIT Mean and the National RIT Norms. Student testing for Language Usage is scored on a scale continuum that spans grades third through eighth and ranges from 0-245.
*Note: The MAP National Norms changed starting fall, 2015 as the District started using the web-based assessment instead of the local server-based assessment.
Narrative of the District RIT Mean and National Norms for Third Grade
The graph below indicates that third grade students tested below or at the national norms in fall 2015 and 2016 and remained below national norms. National norm growth has exceeded local growth. In 2017-18, student scores were above the national norms.
Narrative of the District RIT Mean and National Norms for Fourth Grade
The graph below indicates that fourth grade students achieved near or above the national norms during the past three years and expected growth was consistent with national norms. In the fall 2017, students achieved at the national norm.
Narrative of the District RIT Mean and National Norms for Fifth Grade
The graph below indicates that fifth grade students achieved above the national norms except for spring 2016. Fall to spring growth has not kept pace with national norms.
Narrative of the District RIT Mean and National Norms for Sixth Grade
The graph below indicates that sixth grade students achieved below the national norms except for fall 2015. Fall to spring growth has been slightly below national norms.
Narrative of the District RIT Mean and National Norms for Seventh Grade
The graph below indicates that seventh grade students achieved at or above the national norms during the fall and spring testing except for 2017-18 school year. National growth norms have slightly outpaced local scores.
Narrative of the District RIT Mean and National Norms for Eighth Grade
The graph below indicates that eighth grade students achieved at or just above the national norms during the fall and spring assessments. Growth expectations are mixed when compared to national norms.