

Dynamic Indicators of Early Literacy Skills (DIBELS)
Prologue
DIBELS (Dynamic Indicators of Early Literacy Skills) testing data is collected by the Stevensville School District for students in grades K-6. DIBELS testing assesses students’ ability to read fluently and comprehend grade level text. Student testing is scored on a scale continuum that spans grades kindergarten through sixth and ranges from 0-415. The testing data is used by instructional staff to differentiate student reading instruction with interventions and enrichment.
Students are assessed three times per year (fall, winter, and spring) to measure reading growth. Benchmark testing is a systematic process of screening all students on essential skills predictive of later reading performance. Benchmark data is used by teachers and administrators to monitor the effectiveness of intervention and enrichment instruction.
The graphs are a representation of the district’s grade level benchmark composite scores in comparison to national norms for fall and spring only. Winter testing scores are formative assessments to monitor progress. The DIBELS grade level composite score is a combination of multiple subtests and provides the best overall estimate of the student’s early literacy skills and/or reading proficiency.
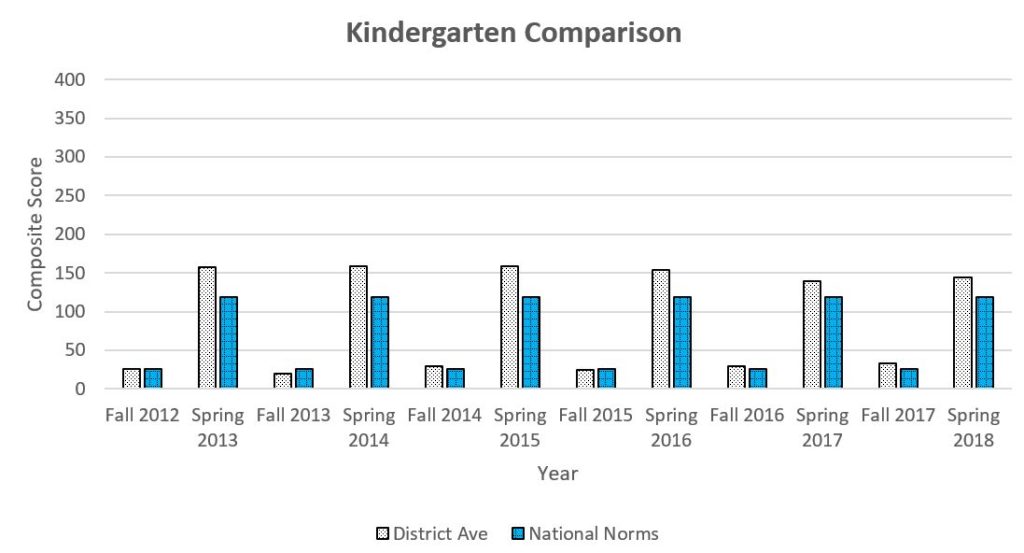
Narrative of the District Average and National Norms Kindergarten Data
Kindergarten composite scores in the fall are comprised of First Sound Fluency and Letter Naming Fluency. In the spring, the composite scores are comprised of Letter Naming Fluency, Phoneme Segmentation Fluency, and Nonsense Word Fluency- CLS (correct letter sounds) score.
The graph indicates that Stevensville kindergarten students begin their school career with reading skills at benchmark or near the national average. Current trends indicate the majority of Stevensville kindergarten students achieve above the national norms by spring testing. As indicated by the graphs, there is significant growth from the fall to the spring which is reflective of rigorous instructional intervention and enrichment strategies provided for students throughout the year.
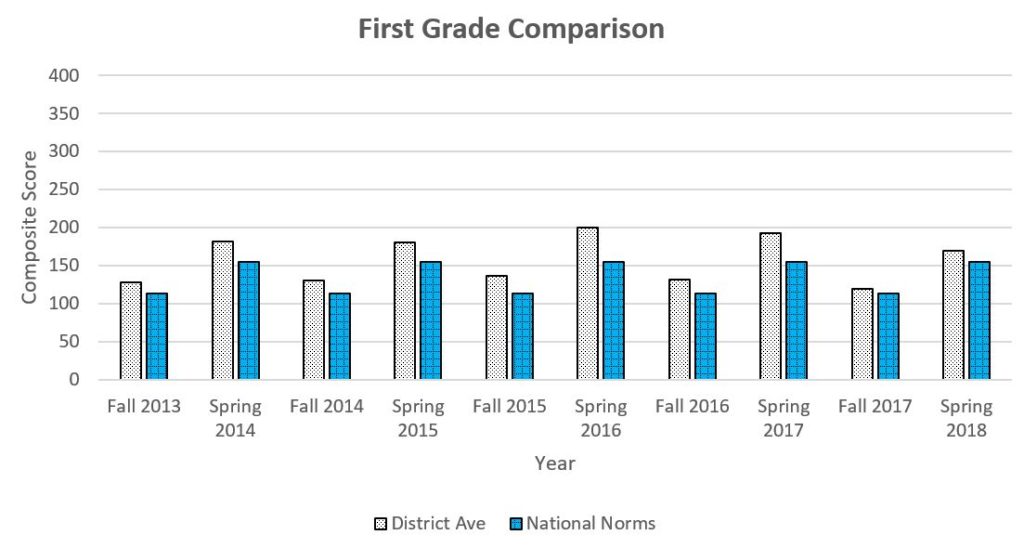
Narrative of the District Average and National Norms First Grade Data
First grade composite scores in the fall are comprised of Letter Naming Fluency, Phoneme Segmentation Fluency, and Nonsense Word Fluency. In the spring, the composite scores are comprised of Nonsense Word Fluency, and Oral Reading Fluency-Words Correct, Retell (oral comprehension), and Oral Reading Fluency-Accuracy.
The graph indicates that Stevensville first grade students begin the year above the national norm. As indicated by the graphs, there is expected growth from the fall to the spring which matches or exceeds national growth norms. This is reflective of rigorous instructional intervention and enrichment strategies provided for students throughout the year.
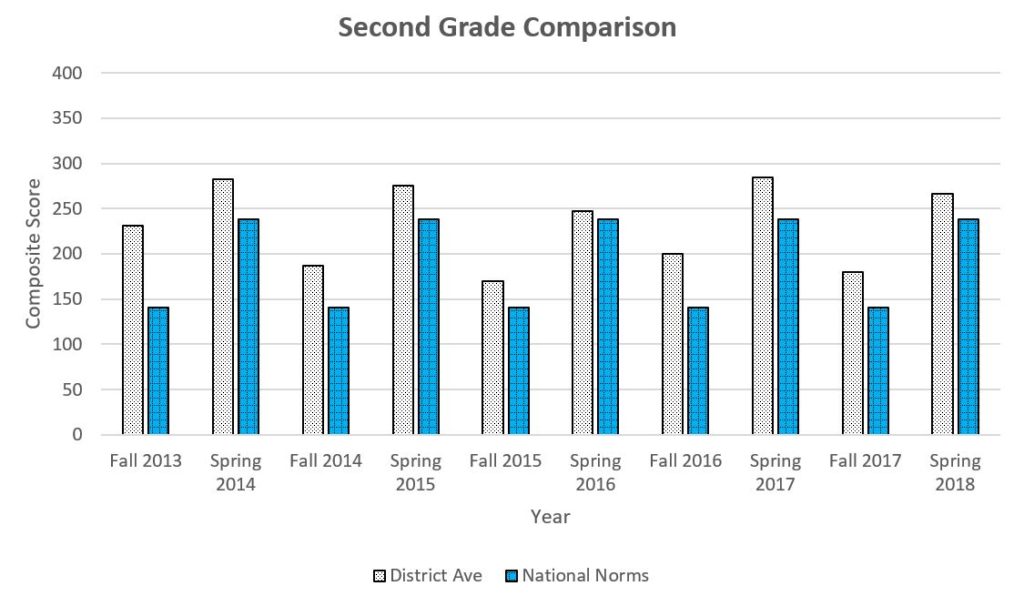
Narrative of the District Average and National Norms Second Grade Data
Second grade composite scores in the fall are comprised of Nonsense Word Fluency- Whole Words Read and Oral Reading Fluency-Words Correct, Retell (oral comprehension), and Oral Reading Fluency-Accuracy. In the spring, the composite scores are comprised of Oral Reading Fluency-Words Correct, Retell (oral comprehension), and Oral Reading Fluency-Accuracy.
Current trends indicate Stevensville second grade students test above national norms on both fall and spring. The second grade composite score continues to be above the spring national composite score in each of these years.
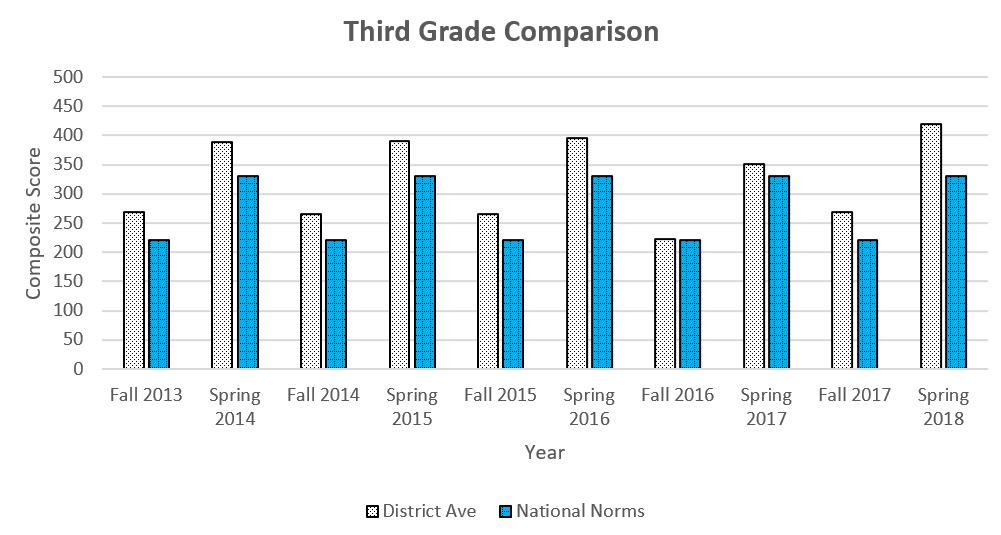
Narrative of the District Average and National Norms Third Grade Data
Third grade composite scores in the fall are comprised of Oral Reading Fluency- Words Correct, Retell (oral comprehension), DAZE (written comprehension), and Oral Reading Fluency- Accuracy. Composite scores in the spring use the same measures.
The graph indicates that Stevensville third grade students begin the year above national norms. By spring, growth in composite scores have been consistently above the national norms and reflect similar growth to national growth averages. In 2016-17 the District saw a decline in the composite scores, but they were still at or above the national average. This trend is consistent for the third grade level improvement for the past three years.
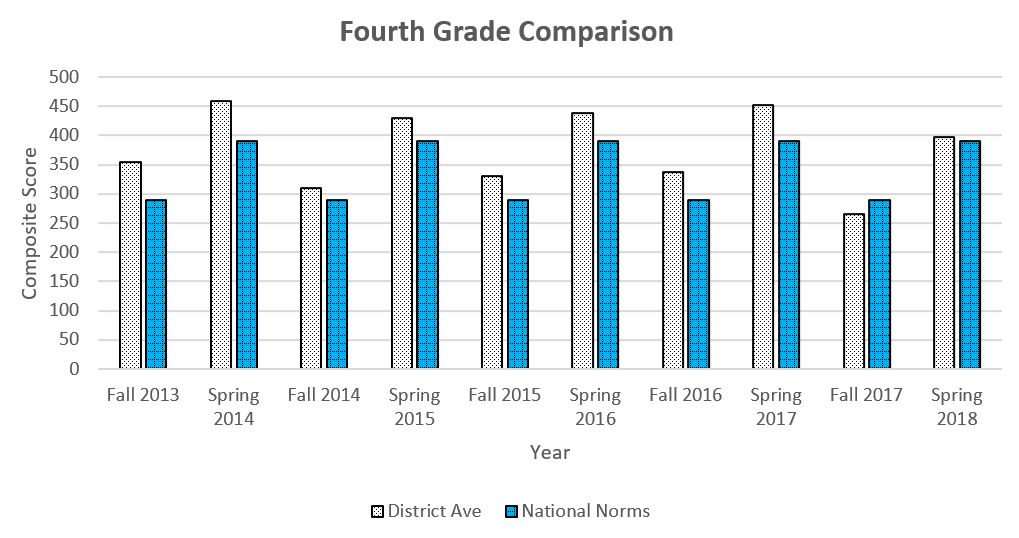
Narrative of the District Average and National Norms Fourth Grade Data
Fourth grade composite scores in the fall are comprised of Oral Reading Fluency- Words Correct, Retell (oral comprehension), DAZE (written comprehension), and Oral Reading Fluency- Accuracy. Composite scores in the spring use the same measures.
The graph indicates that Stevensville fourth grade students begin the year above national norms, with the exception of fall 2017. By spring, growth in composite scores have been consistently above the national norms and reflect similar growth to national averages excluding the 2017-2018 school year. This trend is consistent for the fourth grade level improvement from 2013-2017.
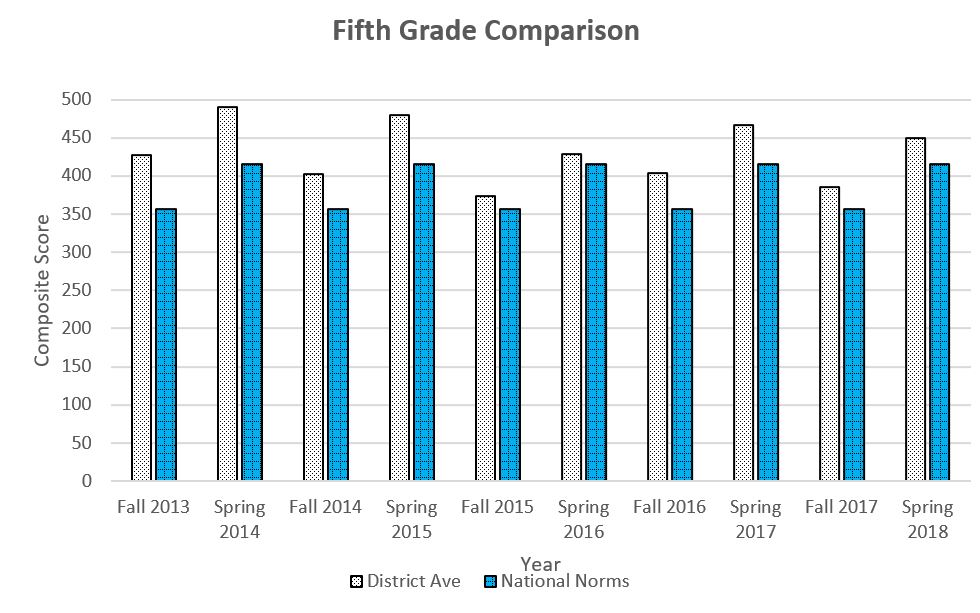
Narrative of the District Average and National Norms Fifth Grade Data
Fifth grade composite scores in the fall are comprised of Oral Reading Fluency- Words Correct, Retell (oral comprehension), DAZE (written comprehension), and Oral Reading Fluency- Accuracy. Composite scores in the spring use the same measures.
The graph indicates that Stevensville fifth grade students begin the year above national norms. By spring, growth in composite scores have been consistently above the national norms and reflect similar growth to national averages. This trend is consistent for the fifth grade level improvement for the past five years.
Narrative of the District Average and National Norms Sixth Grade Data
Sixth grade composite scores in the fall are comprised of Oral Reading Fluency- Words Correct, Retell (oral comprehension), DAZE (written comprehension), and Oral Reading Fluency- Accuracy. Composite scores in the spring use the same measures.
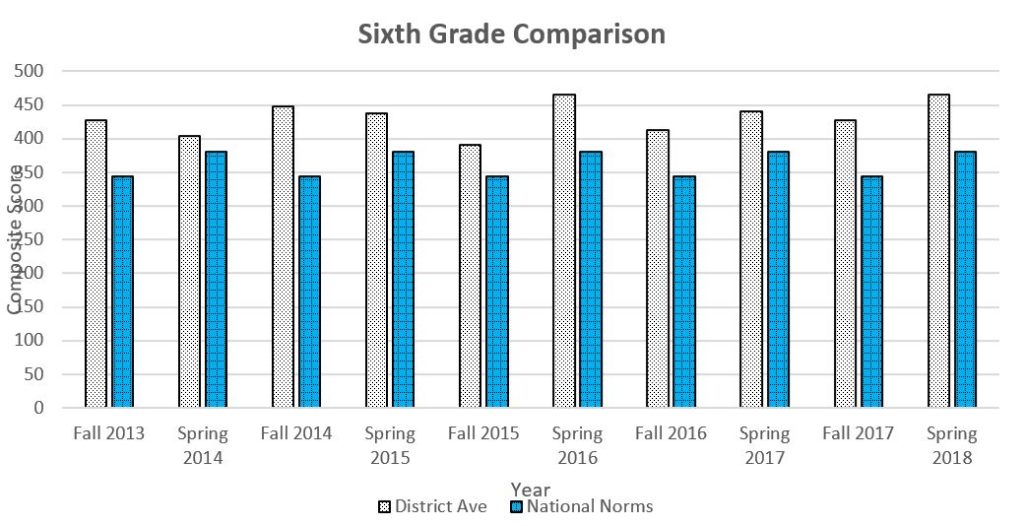
The graph must be interpreted with caution. Not all students were assessed using this test as described in the NOTE below. Only students receiving intensive/strategic reading instruction were tested in the spring 2014, spring 2015, and the school year 2015-2016. Because of this lack of consistency in the testing group, local scores appear to decline from fall to spring but are not a reflection of the entire class cohort. Beginning the fall of 2016, all students were included in the testing cohort and scores should be interpreted as such.
NOTE: A grade-level team decision was made to only assess the intensive population during the spring 2014, spring 2015, and the school year 2015-2016. This graph does not accurately reflect a school wide comparison to national norms. However, our student population needing intensive reading interventions still score above the national norm for this grade level.