
Reading Curriculum-Based Measurement (CBM)
Reading Comprehension (MAZE)
Prologue
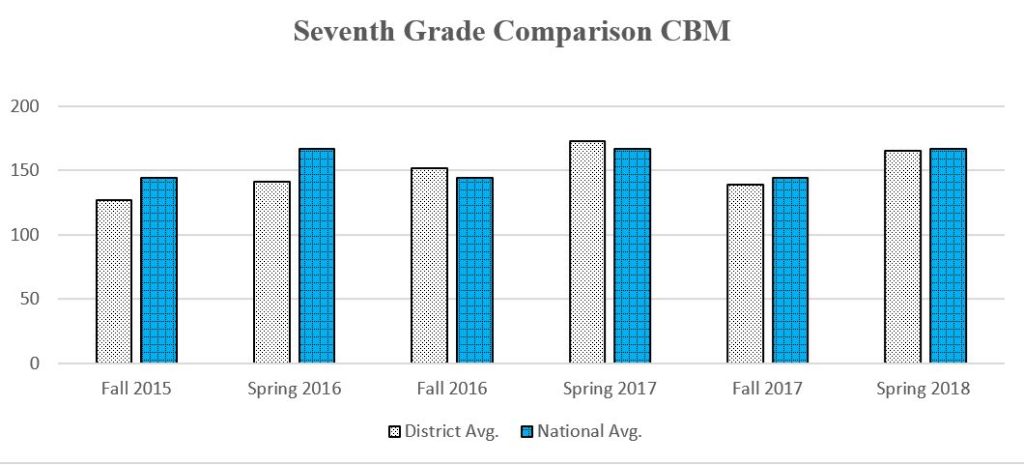
Reading CBM (Curriculum-Based Measurement) testing data is collected by the Stevensville School District for students in grades 7-8. Reading CBM’s are brief, individually administered, standardized assessment of oral reading. They are designed to be used in the universal screening of all students. Students are assessed three times per year (fall, winter and spring) to measure reading growth. Student scores are based on Words Read Correct (WRC) and they range from 0-213. The testing data can then be used by instructional staff to differentiate student reading instruction within the classroom for interventions and enrichment.
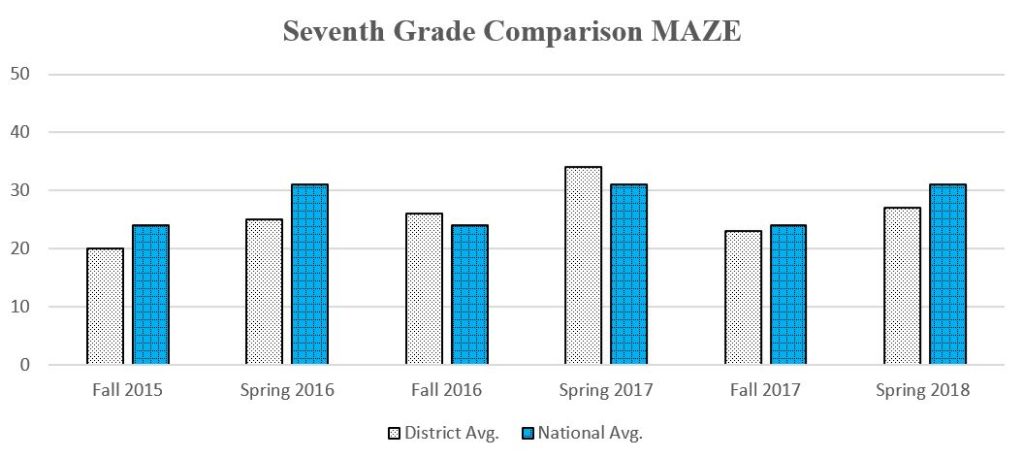
Reading Comprehension (MAZE-multiple choice close) is another measure of reading comprehension. “MAZE can be used as a corroborative or supplemental measure to provide a more complete picture of students’ reading skills.” Student scores are based on Responses Correct (RC) and they range from 0-50.
The following graphs are a representation of the district’s grade level average reading score for the seventh and eighth grade in comparison to national norms for fall and spring only. Winter testing scores are formative assessments to monitor progress. Students in grades seventh and eighth started testing in the fall of 2015, with the eighth grade starting in the winter of 2016. It also needs to be noted that only 7th grade students receiving intensive and strategic instruction were tested in the fall of 2015.
Narrative of the District Average and National Norms for Seventh Grade Data
The seventh grade data shows that in the past three years students in the fall were below the National average in 2015 and 2017. In the spring of 2017, students were above the national average in the reading CBM.
The seventh grade MAZE data shows that students performed above the national average for the year 2016-17. They are below or just below the national average in 2015-16 and 2017-2018 school year.
Narrative of the District Average and National Norms for Eighth Grade Data
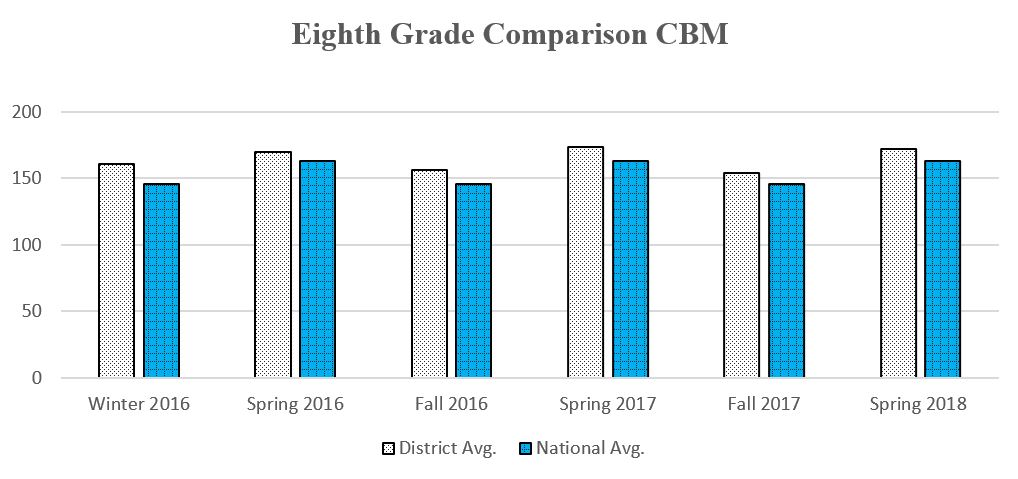
The eighth grade started testing in the winter of 2016. All students were assessed. The data shows that eighth grade students were above the national average for all three years.
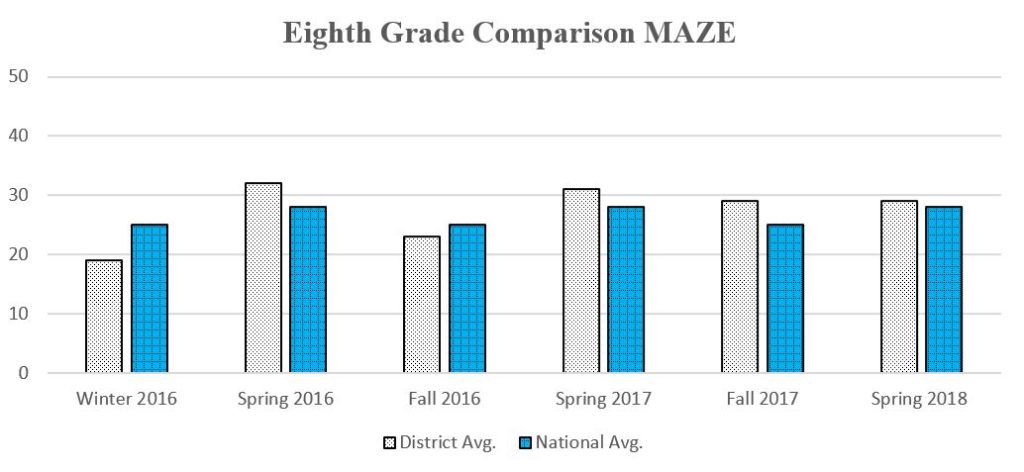
The MAZE data shows that in the winter of 2016 and fall of 2016 students were below the national average. They have made gains in both years from winter/fall to spring.