
ACT Score Comparison Grade Eleven
Prologue
The ACT (American College Test) is a college assessment test administered annually to all high school juniors as mandated by the state of Montana for federal reporting. It measures student academic readiness for college. At the district level, scores are used as performance benchmarks for all students. The tests are also used to gauge curriculum effectiveness in comparison to state norms. High school students are assessed once per year in the spring of their junior year.
The graphs below are a representation of the Stevensville School District’s average score in comparison to state averages in a side-by-side comparison by subject (English, Math, Reading, Science), and as a composite score.
Average Compared to State Average
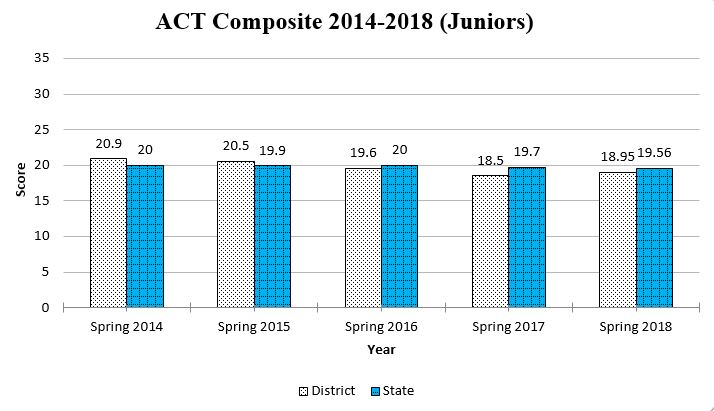
Narrative of the District and State Average Composite Scores
The ACT exam is required for all juniors (since 2013). Stevensville student scores exceeded state averages in 2014 and 2015. They declined to below the state average in the past three years. In 2014, the state average composite score was 20. The Stevensville Junior’s average composite score was 20.9. . In 2015, the state average composite score was 19.9. The Stevensville Junior’s average composite score was 20.5. In 2016, the state average composite score was 20. The Stevensville Junior’s average composite score was 19.6. In 2017, the state average composite score was 19.7. The Stevensville Junior’s average composite score was 18.5. In 2018, the state average composite score was 19.56. The Stevensville Junior’s average composite score was 18.95.
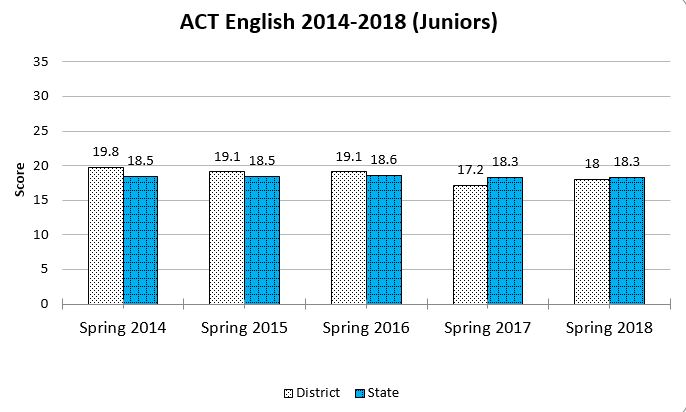
English
The graph below indicates that Stevensville students’ English scores exceed state averages from 2014-2016. In 2017, Stevensville students’ scores were below the state average. In 2014, the state average English score was 18.5. The Stevensville Junior’s average score was 19.8. In 2015, the state average English score was 18.5. The Stevensville Junior’s average score was 19.1. In 2016, the state average English score was 18.6. The Stevensville Junior’s average score was 19.1. In 2017, the state average English score was 18.3. The Stevensville Junior’s average score was 17.2. In 2018, the state average English score was 18.3. The Stevensville Junior’s average score was 18.
Reading
The graph below indicates that Stevensville students’ average reading scores in 2014 were above the state average. In 2014 and 2015, scores exceed the state averages. Between 2016 and 2018, scores dropped within the district and are below the state averages. In 2014, the state average reading score was 20.5. The Stevensville Junior’s average score was 22.1. In 2015, the state average reading score was 20.3. The Stevensville Junior’s average score was 21.4. In 2016, the state average reading score was 20.7. The Stevensville Junior’s average score was 20.4. In 2017, the state average reading score was 20.3. The Stevensville Junior’s average score was 19.3. In 2018, the state average reading score was 20.2. The Stevensville Junior’s average score was 19.5.

Math
The graph below indicates that Stevensville students’ average ACT math scores stay close to the state scores. The district average score in 2014 and 2015 exceeded the state scores. Scores dropped below the state averages from 2016-2018. In 2014, the state average math score was 20.2. The Stevensville Junior’s average score was 20.5. In 2015, the state average math score was 20. The Stevensville Junior’s average score was 20.5. In 2016, the state average math score was 20. The Stevensville Junior’s average score was 19.3. In 2017, the state average math score was 19.8. The Stevensville Junior’s average score was 18.6. In 2018, the state average math score was 19.5. The Stevensville Junior’s average score was 18.9.

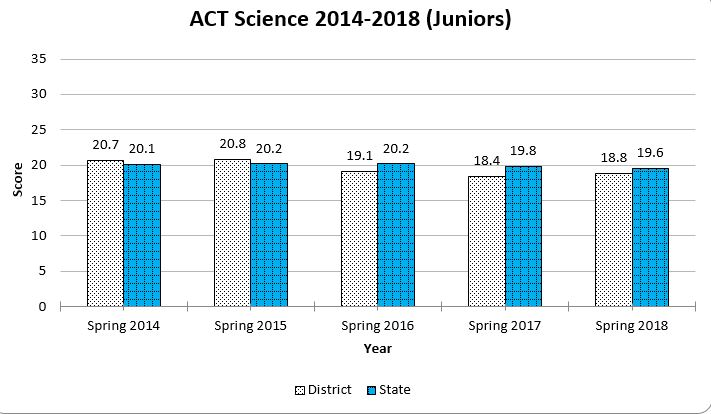
Science
The graph below indicates that Stevensville students’ science scores have fluctuated from 2014-2018; gradually increasing from 2014-2015 but fell in 2016, 2017, and 2018. The scores were higher than the state averages in 2014 and 2015. In 2014, the state average science score was 20.1. The Stevensville Junior’s average score was 20.7. In 2015, the state average science score was 20.2. The Stevensville Junior’s average score was 20.8. In 2016, the state average science score was 20.2. The Stevensville Junior’s average score was 19.1. In 2017, the state average science score was 19.8. The Stevensville Junior’s average score was 18.4. In 2018, the state average science score was 19.6. The Stevensville Junior’s average score was 18.8.
ACT Score Comparison Graduating Class
Prologue
The ACT is a college assessment test administered annually to all high school juniors once a year as mandated by the state of Montana for federal reporting. However, students are allowed to take the test multiple times outside of the mandatory testing day to improve their scores. These scores represent the most recent scores for students within the graduating class.
These graphs show the average ACT scores for Stevensville graduating students over the last five years. Each graph compares Stevensville students with state and national averages in a side-by-side comparison by subject (English, Math, Reading, Science), and as a composite score.
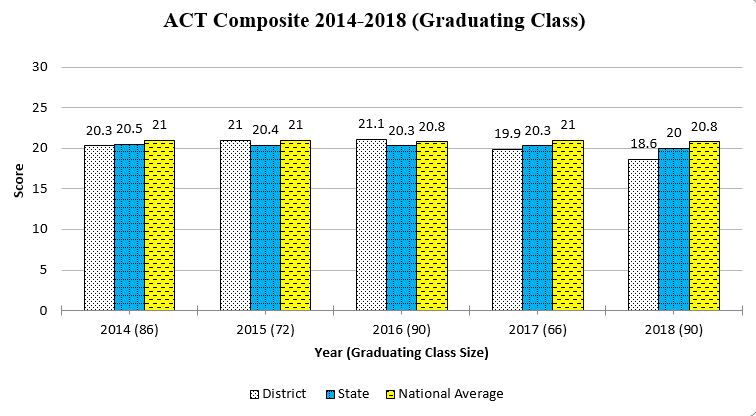
Narrative of the District, State, and National Average Composite Scores
Beginning in 2014 Stevensville students’ scored below the state and national averages, but saw an increase in 2015 and 2016 when scores again exceeded both the state and national average in the composite score. In 2017 and 2018, Stevensville students’ scores were below both the state and national average. In 2014, the national average composite score was 21. The state average score was 20.5. The Stevensville graduating class average score was 20.3. In 2015, the national average composite score was 21. The state average score was 20.4. The Stevensville graduating class average score was 21. In 2016, the national average composite score was 20.8. The state average score was 20.3. The Stevensville graduating class average score was 21.1. In 2017, the national average composite score was 21. The state average score was 20.3. The Stevensville graduating class average score was 19.9. In 2018, the national average composite score was 20.8. The state average score was 20. The Stevensville graduating class average score was 18.6.
English
The graph below indicates that Stevensville students have been slightly lower than the national average, but have been above the state average score since 2014, excluding 2018. In 2014, the national average English score was 20.3. The state average score was 19.3. The Stevensville graduating class average score was 19.6. In 2015, the national average English score was 20.4. The state average score was 19.1. The Stevensville graduating class average score was 20.1. In 2016, the national average English score was 20.1. The state average score was 19. The Stevensville graduating class average score was 19.7. In 2017, the national average English score was 20.3. The state average score was 19. The Stevensville graduating class average score was 19.6. In 2018, the national average English score was 20.2. The state average score was 18.7. The Stevensville graduating class average score was 17.3.

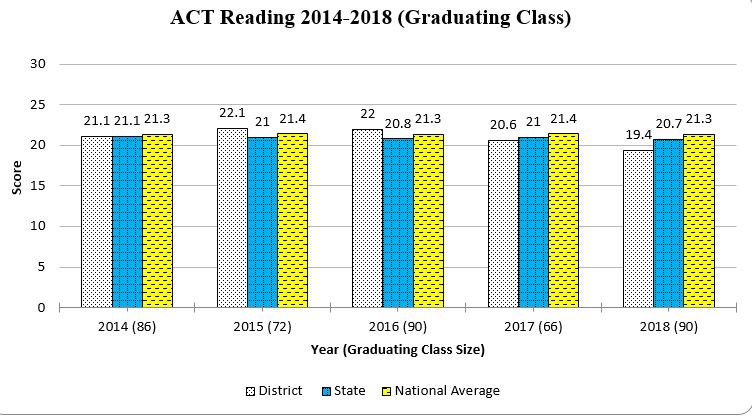
Reading
The graph below indicates that Stevensville students have met or exceeded both the national and state averages from 2014-2016. In two of the past five years, Stevensville has scored higher than the national average. In 2017 and 2018, Stevensville students’ scored below both state and national averages. In 2014, the national average reading score was 21.3. The state average score was 21.1. The Stevensville graduating class average score was 21.1. In 2015, the national average reading score was 21.4. The state average score was 21. The Stevensville graduating class average score was 22.1. In 2016, the national average reading score was 21.3. The state average score was 20.8. The Stevensville graduating class average score was 22. In 2017, the national average reading score was 21.4. The state average score was 21. The Stevensville graduating class average score was 20.6. In 2018, the national average reading score was 21.3. The state average score was 20.7. The Stevensville graduating class average score was 19.4.
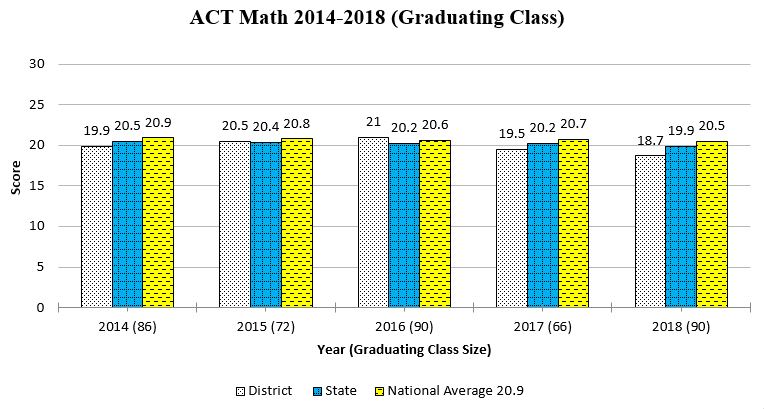
Math
The graph below indicates that three out of five years Stevensville students scored slightly lower than the state and/or national averages, though in 2016 students scored higher than both the state and national averages. In 2014, the national average math score was 20.9. The state average score was 20.5. The Stevensville graduating class average score was 19.9. In 2015, the national average math score was 20.8. The state average score was 20.4. The Stevensville graduating class average score was 20.5. In 2016, the national average math score was 20.6. The state average score was 20.2. The Stevensville graduating class average score was 21. In 2017, the national average math score was 20.7. The state average score was 20.2. The Stevensville graduating class average score was 19.5. In 2018, the national average math score was 20.5. The state average score was 19.9. The Stevensville graduating class average score was 18.7.
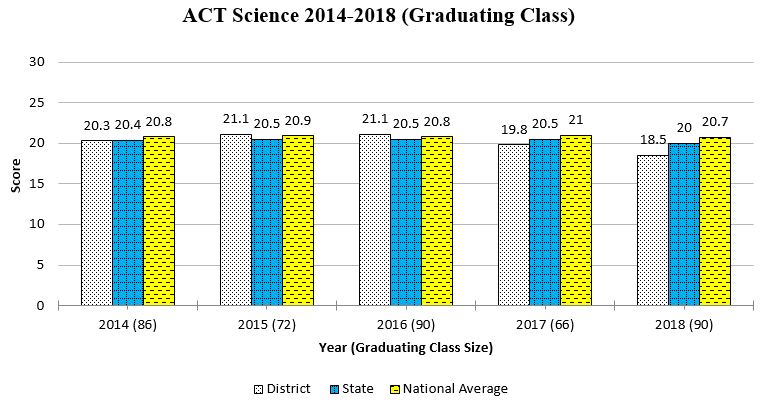
Science
The graph below indicates that Stevensville students’ scores were higher than the national average in two of the five years reported. In 2014, the national average science score was 20.8. The state average score was 20.4. The Stevensville graduating class average score was 20.3. In 2015, the national average science score was 20.9. The state average score was 20.5. The Stevensville graduating class average score was 21.1. In 2016, the national average science score was 20.8. The state average score was 20.5. The Stevensville graduating class average score was 21.1. In 2017, the national average science score was 21. The state average score was 20.5. The Stevensville graduating class average score was 19.8. In 2018, the national average science score was 20.7. The state average score was 20. The Stevensville graduating class average score was 18.5.